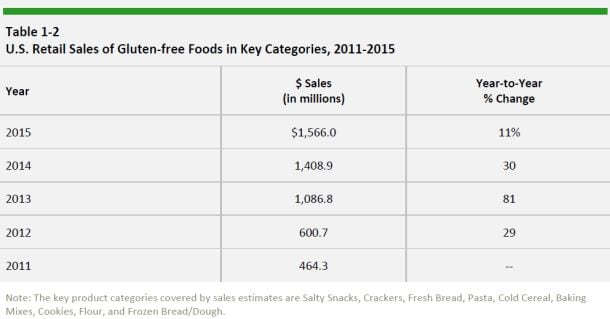
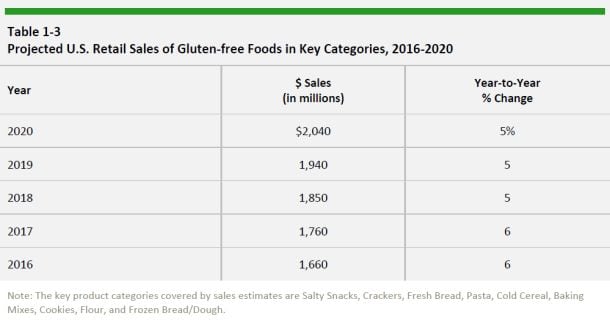
To provide context, Packaged Facts shows how growth rates have slowed from high double digits (+81% in 2013 and +30% in 2014) to low double digit growth in 2015 (+11%), and predicts they will stabilize at a steady 5-6% a year in the next five years.
Unlike some other market researchers, which include everything with a gluten-free label in their market definitions (whether the product would typically contain gluten or not), Packaged Facts focuses more narrowly on traditionally grain-based products in the following categories: Salty Snacks, Crackers, Fresh Bread, Pasta, Cold (ready-to-eat) Cereal, Baking Mixes, Cookies, Flour, and Frozen Bread/Dough.
It does not, for example, cover potato chips or ready-to-eat popcorn as these are classed as “naturally gluten-free foods,” and it does not include things like gluten free frozen pizza, lasagna, stuffing mix or entrees (click HERE to find out more about the report).
A fragmented market
While the market is maturing, it is still quite fragmented, notes Packaged Facts, which estimates that only Hain Celestial and Pinnacle Foods have market shares exceeding 10%, with Hain leading in salty snacks and Pinnacle leading in fresh bread and cookies (via its subsidiary Boulder Brands).
“More than half the market is made up of companies whose sales account for 4% or less of mass-market sales of gluten-free foods. B&G Foods/Pirate Brands, Calbee North America, Blue Diamond Growers, and TH Foods/Crunchmaster compete in their respective categories with a single product line.”
Who is the gluten-free consumer?
Consumer surveys commission by Packaged Facts suggest that the percentage of consumers purchasing or using foods labelled as gluten-free is growing, while the percentage who say they are purchasing more gluten-free foods is declining.
In the restaurant sector, meanwhile, data fromDatassential MenuTrends show that 24% of restaurants serve gluten-free options compared with 20% in 2015, a notable rise in a pretty short period.
As for demographics, consumers with a household income of $150,000+ are much more likely than average (index of 145) to report that they are watching their diet due to gluten intolerance (or non-celiac gluten sensitivity - a condition for which there is no validated biomarker or diagnostic test), says Packaged Facts.
As for gender, it says women are far more likely than men to be watching their diets because of a food allergy (at an index of 151) or gluten intolerance (index of 138), as are apartment dwellers, Northeasterners, and those with a higher level of education.

As for age, consumers aged 35-49 (Gen X) are also significantly more likely than average to be watching their diet because of a food allergy or gluten intolerance, says Packaged Facts.
Why do Americans buy gluten-free foods?
When it comes to purchase motivations, 30% of consumers** that have purchased gluten-free products in the past three months acknowledge that ‘some products that I buy for other reasons are marked gluten-free,’ but 29% argue that gluten-free products are “generally healthier,” 20% say they buy them to “manage my weight,” and 18% argue that gluten-free products are “generally of higher quality.”
15% say they buy gluten free because a household member has gluten sensitivity or food allergies, while 9% say they buy them as a household member has celiac disease.
*This figure includes all retail channels, including mass market, specialty stores, and the internet.
** In the Packaged Facts July/August 2016 National Consumer Survey of 2,000 US adults.