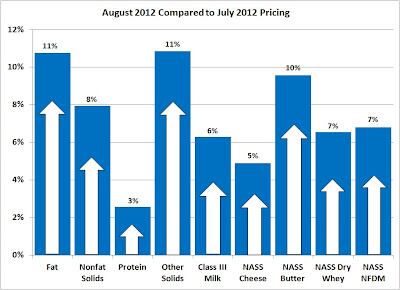
August Class and Component milk prices were announced on August 29. The Class III milk price increased to $17.73/cwt from $16.68 in July, a 6% increase.
The increase was driven by 5% increase in cheese and a 10% increase in butter. The size of the increase in butter was unexpected.
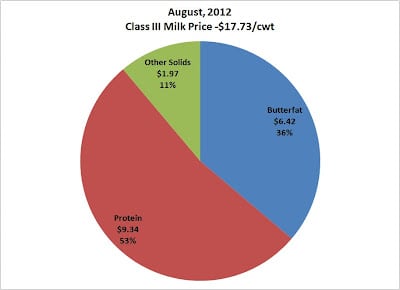
These changes have slightly altered the make-up of the Class III milk price shown in Chart 2.
In July, protein made up 54% of the milk payment and in August, it made up 53%. While the milk protein price was up just 3% and butterfat was up 11%, it is important to note that the factors influencing the payment chart were only slightly affected.
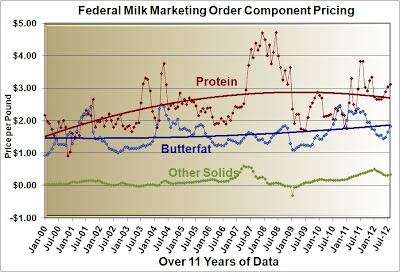
The long term trends remain very positive. Butter increased to the level of its recent trend line as shown in Chart 3 andmilk protein continued to increase above its long term trend.
As will be discussed below, there is reason to believe that in the short term butterfat will continue to increase in price faster than milk protein.By far,the most important component for the dairy producer is still milk protein.
The most important goal of the dairy producer who wants to increase revenue is to find ways to increase milk protein pounds. This typically involves an increase in milk production and an increase in milk protein percent.
However, in the long term, milk protein prices will increase more than butterfat as both consumer consumption and exports drive higher demand for cheese.
Cheese
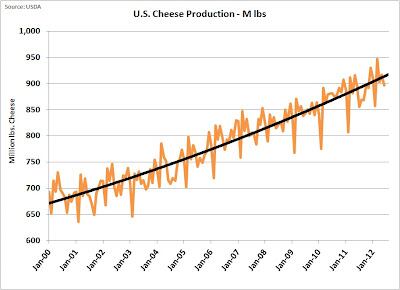
Demand for cheese continues to grow and production also continues to grow to meet that demand.
Over the last twelve years, cheese production has increased nearly 40%. There is no reason to expect this trend to change.
Per capita consumption in the U.S. has not reached European levels and has shown steady growth over time.
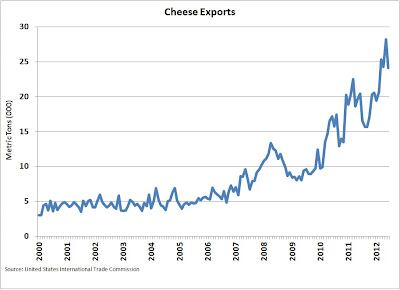
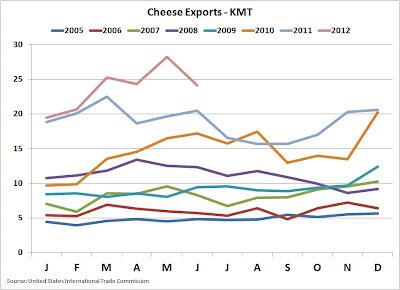
Exports of cheese remain very healthy (chart 4) with a record June export level (Chart 5).
Since 2006, cheese exports have seen a very steady and healthy increase. Currently industry assistance programs are well positioned to support U.S. exports of dairy products and cheese appears to be the strongest segment of this growth.
Chart 6 shows a 500% increase in the volume of cheese exports during the last 12 years.
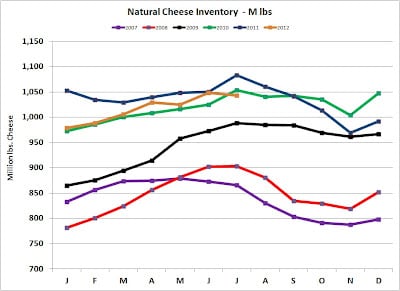
Cheese inventories are remaining in balance between production and demand. Cheese in the U.S. is reported as “Natural Cheese” and “Processed Cheese”.
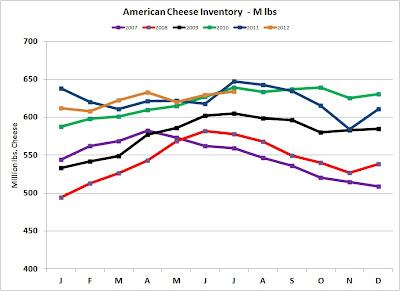
“Processed Cheese” has whey and other additives to make a cheese product that is not all “Natural Cheese.” Charts 7 and 8 illustrate that there are no significant bubbles or severe shortages in cheese inventories which could disturb pricing.
For part two of John’s monthly commodities update and a look ahead to September, visit www.dairyreporter.com on Thursday 6 September.
You can see John's month-to-month dairy commodity breakdowns at his blog, MilkPrice.