The changing American diet, 1999-2012: ERS data shows steady decline in consumption of ice cream and corn-based sweeteners

By Elaine Watson

- Last updated on GMT

Per capita availability of caloric sweeteners dropped from 160.9lbs in 1999 to 138.9lbs in 2012, primarily due to a sharp drop in availability of corn-based sweeteners

Related tags Corn syrup Sweeteners Milk

While data showing that fluid milk consumption has continued to fall in the past 15 years probably won’t shock many readers, they may be more surprised to learn that consumption of caloric sweeteners and ice cream has also dropped substantially since 1999, while intakes of butter, yogurt and mozzarella cheese have grown.

According to food availability data​* from USDA’s Economic Research Service, which the ERS says “serves as a proxy for Americans' food consumption over time​”, US availability of ice cream has fallen to 12.9lbs per person in 2012, down from 16.7lbs in 1970.

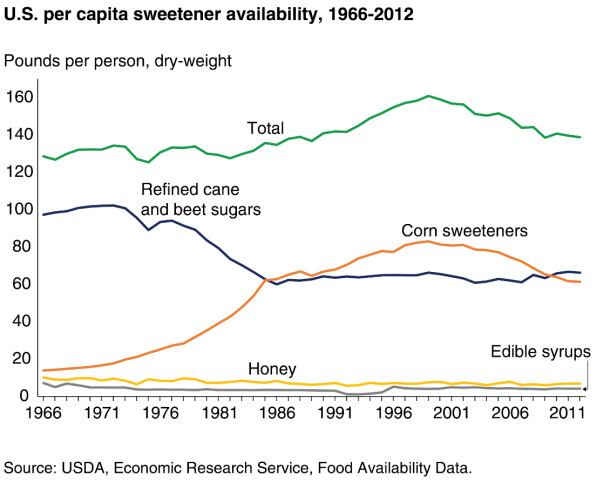
High fructose corn syrup availability down, cane/beet sugar availability flat

Meanwhile, per capita availability of caloric sweeteners dropped from 160.9lbs in 1999 to 138.9lbs in 2012, primarily due to a sharp drop in availability of corn-based sweeteners (high-fructose corn syrup, glucose syrup, and dextrose), down 26% from 83.1lbs per person in 1999 to 61.4lbs in 2014 (click HERE​). 

Cane and beet sugar availability has been fairly flat over the same period at around 66lbs per person, while per capita availability of honey has also remained pretty steady since 1999 at 6.9lbs despite recent retail price increases.

However, overall availability of caloric sweeteners in 2012 was still slightly higher than it was in the late 1960s.

US per capita sweetener availability

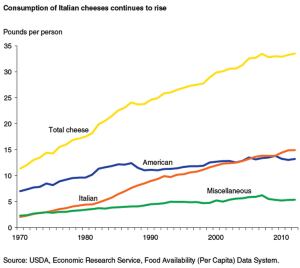
Cheese and butter intakes up

As for cheese, per capita availability almost tripled from 11.4lbs in 1970 to 33.5lbs in 2012, with much of the growth coming from Mozzarella.

Butter availability rose from 4.5lbs in 2000 to 5.6lbs in 2012 as consumers bought into its ‘all-natural’ credentials.

Dairy availability data ERS
Cheese availability

*According to the USDA, “Food availability data calculates the annual supply of a commodity available for humans to eat by subtracting measurable nonfood use (farm inputs, exports, and ending stocks) from the sum of domestic supply (production, imports, and beginning stocks).

“Per capita estimates are determined by dividing the total annual supply of the commodity by the U.S. population for that year.

"Although these estimates do not directly measure actual quantities ingested, they serve as a proxy for Americans' food consumption over time.”

Related news

Related products

show more

Sustainably sourced. Naturally versatile.

Sustainably sourced. Naturally versatile.

Content provided by Covation Bio™ PDO | 15-Apr-2024 | Insight Guide

Zemea® USP-FCC propanediol is a 100% plant-based alternative to petroleum-based glycols. Used as a flavor carrier, processing aid and humectant, this ingredient...

Some home truths about real prebiotic dietary fibre

Some home truths about real prebiotic dietary fibre

Content provided by BENEO | 22-Mar-2024 | Product Presentation

Confused about prebiotics? You’re not the only one! Food developers wanting to work with prebiotic dietary fibre are faced with an abundance of products...

PREPARING FOR Q4 & Q1 2024

PREPARING FOR Q4 & Q1 2024

Content provided by Icon Foods | 24-Jan-2024 | White Paper

Good afternoon fellow food manufacturers, formulators, and enthusiasts of Clean Label Sugar Reduction. You know, in the past, we’ve seen our fair share...

Related suppliers

Follow us

Products

View more

Webinars