Overall, sugar confectionery is growing a little faster than chocolate, although there are bright spots throughout the category, notably gummies and jellies, and Halloween candy, said Jordan Rost, VP, consumer insights at Nielsen.
So where is the market going from here?
There are multiple headwinds, from long-term challenges around cocoa sourcing to health & wellness trends and a renewed focus on sugar, added Rost, but a closer examination of which consumers are over- and under-indexing in certain categories also highlights other challenges and opportunities for manufacturers.
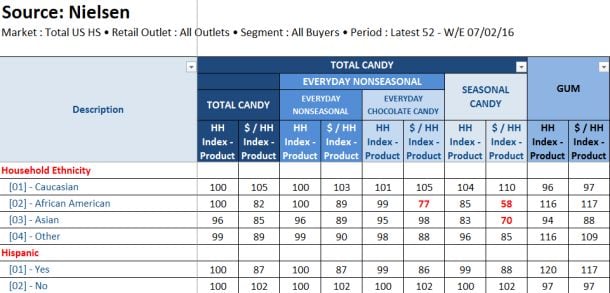
African Americans, Asians, Hispanics, under-index on candy
For example, one notable finding from Nielsen Homescan data is that Asian Americans, Hispanics and African Americans under-index across the board on candy purchases, while Caucasians over-index. The one exception is gum, where African American and Hispanic consumers are heavier buyers, said Rost.
“Manufacturers need to work harder to make products relevant to growing multicultural audiences especially in seasonal candy, which is really an area of untapped opportunity. They have to find a way to connect in an authentic way.”
Meanwhile, despite food marketers’ obsession with Millennials, the consumer groups that significantly over-index when it comes to spending on candy are empty nesters and senior couples, he said.
As for chocolate, while the figures might not seem that inspiring (everyday chocolate $sales were +1.7% and unit sales -2% in the year to May 28, 2016), there are pockets of opportunity, he said.
Chocolate lovers are trading up
“Unit sales in everyday chocolate are still down, but they were down by 2% in the last year compared with a 4% drop the previous year, while we’re also seeing chocolate just becoming more of a premium product [partly explaining why dollar sales are up as unit sales are dropping], so I still think the future is bright; we’re seeing a lot of innovation in higher priced products and a lot of new players come into the category.
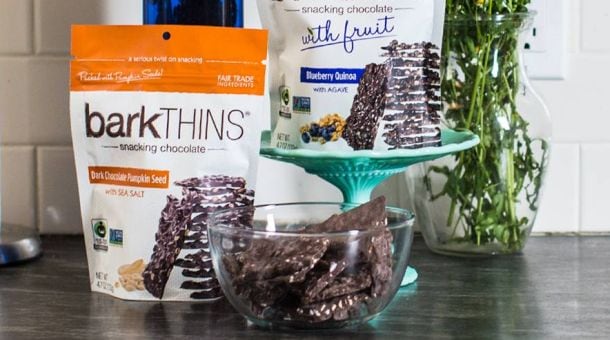
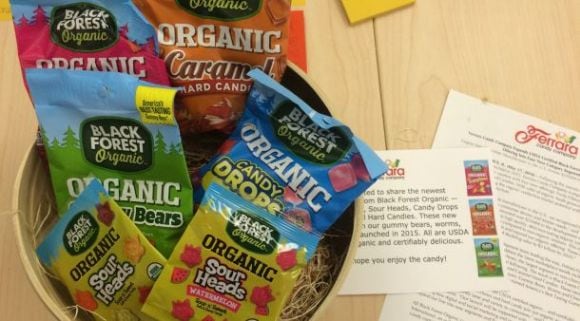
“Younger consumers are looking for innovative products that are more health focused, but they are more focused on what is in the product that what isn’t in it, so we’re seeing things like organics, ancient grains and other ingredients in chocolate now.”
According to data provided by Nielsen spanning all outlets combined (c-stores, grocery, drug, mass, dollar, club, military) in the 52 weeks to May 28, 2016:
TOTAL CANDY (excluding gum): $21.57bn
- Dollar sales: +2.4%
- Unit sales: -1.6%
EVERYDAY CHOCOLATE: $11.23bn
- Dollar sales of everyday (ie. non-seasonal) chocolate: +1.7%
- Unit sales of everyday chocolate: -2%
EVERYDAY NON-CHOCOLATE CANDY (SUGAR CONFECTIONERY): $6.8bn
- Dollar sales of everyday non-chocolate candy: +4.4%
- Unit sales of everyday non-chocolate candy: +0.7%
- Growth area: everyday gummies/jellies ($+7.8% in 52 weeks to July 16)
SEASONAL CANDY (chocolate and sugar confectionery combined): $3.54bn
- Dollar sales of seasonal candy: +1%
- Unit sales of seasonal candy: -5.9%
- Growth areas: Halloween and Christmas candy
GUM: $3bn
- Dollar sales of gum: -0.4%
- Unit sales of gum: -3.6%