“The BRIC markets are the strongest source of growth today, but in 20 years’ time, the economy of Sub Saharan Africa will be bigger than the UK’s”, predicts Rambaut Fairley, associate partner at OC&C Strategy Consultants, the global consultancy firm behind the index.
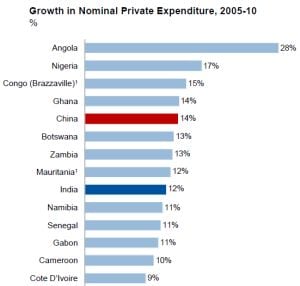
And while there are political and distribution challenges facing any firm thinking of setting up shop in Africa, it holds significant growth potential, with several African countries - Angola, Nigeria, Congo (Brazzaville), Ghana, Botswana, Zambia and Mauritania - already matching or outpacing China’s and India’s growth in household spending in recent years, he points out.
“I think we will start to see more of a cluster strategy - where companies home in on regions of Africa such as the Ivory Coast, Ghana, Cameroon and Nigeria in the west; Namibia, Botswana and Zimbabwe in the south; and Kenya, Tanzania and Mozambique in the east.”
Several African countries have already matched or outpaced China’s and India’s growth in household spending in recent years
Meanwhile, private equity firms have also started to “get in early” and invest in local players in the brewing sector, with the expectation that they will see a return on their investment when these firms are snapped up by acquisitive overseas buyers, he adds.
While several players in the OC&C top 50 including Coca-Cola (which plans to invest $12bn in Africa by 2020), SAB Miller, Heineken, Diageo (eager to break into Mozambique and Angola), Heinz, Unilever (rolling out Shakti ‘direct to consumer’ distribution in Africa) and Nestlé have already built a presence in Africa, less than a third of the top 50 have a presence there, and many that do only operate in one or two markets, says Fairley.
PepsiCo vs Coca-Cola
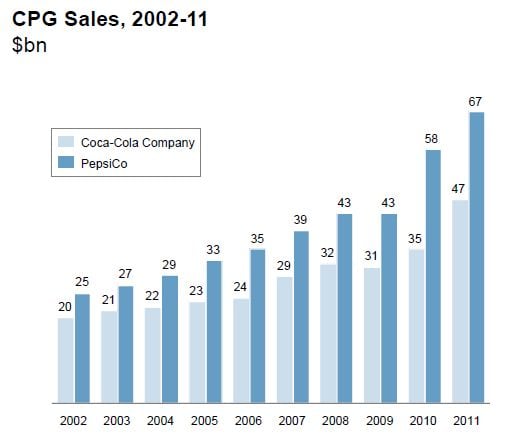
So how are the top two US beverage players in the index performing?
If sheer size - and sales growth - is the measure of success, PepsiCo is ahead, posting a compound annual growth rate in sales revenues (2002-2011) of 11.4% versus Coke’s 10.1%.
However, Coke has outperformed PepsiCo on the profitability front, generating an operating profit CAGR of 7.6% vs PepsiCo’s 7.5% over the same period.
And while Coke has an impressive global supply chain system supplying 200+ countries, and has developed some very successful products for the Chinese market such as Minute Maid Pulpy, PepsiCo has a more diversified portfolio spanning beverages, cereals and snacks, and sports nutrition.
It has also built - almost overnight - a significant presence in dairy: PepsiCo is now the #1 player in Russia thanks to its acquisition of Wimm-Bill-Dann and recently tied up with Müller to enter the US yogurt market, further reducing its dependence on soda and chips, notes Fairley.
PepsiCo is also the #1 food and beverage business in India and the Middle East, #2 in Mexico and in the top 5 in Brazil, Turkey, Vietnam, the Philippines and Thailand, he adds.
“I know not everyone agrees on this, but in my view, PepsiCo is winning the battle.”
10-year CAGR of OC&C top 50 is 6.1% - lower than CPG global average of 7.3%
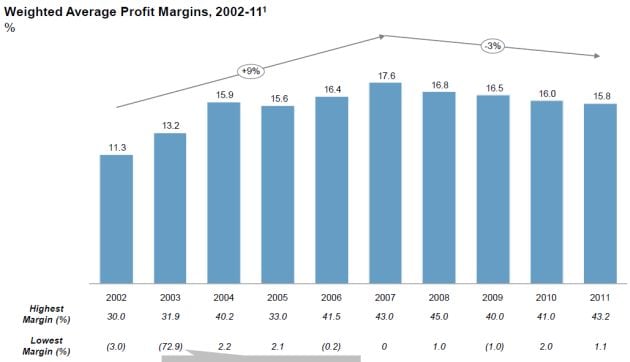
But what can we learn from the 10-year data about the top 50 overall?
On the face of it, they are doing pretty well, notes Fairley, notching up a CAGR of 6.1% in the 2002-11 period.
However, the global CPG market has grown at 7.3% during the same period, suggesting that bigger is not necessarily better, he adds.
“We see margins of the top 10 decline over time and their margin advantage over the next 40 companies erode suggesting world’s largest CPG companies are struggling to keep control of such large businesses.”
Meanwhile, operating margins of the top 50 overall have been on a downward trajectory since peaking at 16% in 2007 owing to commodity inflation and the tough consumer spending environment, although the 2012 index (which OC&C will publish this summer) is likely to suggest a “flattening” of this trend as commodity price pressures eased a little, he said.
Click here to read part one.