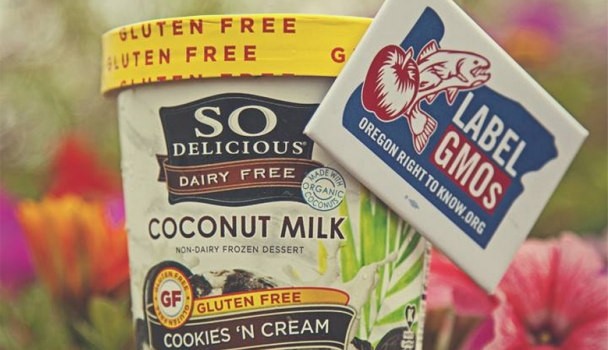
The biggest rise was in products making non-GMO or GMO-free claims
Non-GMO, gluten-free, Kosher, vegan, all-natural… What can we learn from claims made on new products in the US in 2014?
Using data from its Global New Products Database (GNPD), which tracks new product launches, Mintel has been measuring the percentage of new products making scores of label claims spanning everything from gluten-free to prebiotics over several years.
Given the length of time it takes to get a product from concept to launch, looking at claims on products launched in 2014 is not necessarily going to predict hot new trends for 2015 and beyond, but looking at the data over the past six years provides a good indication of the direction in which the market is going, director, innovation & insight, Lynn Dornblaser, told FoodNavigator-USA.
Claims on the rise 2009-2014 (% of new products making the following claims)
- Kosher: 2014 (40.6%), 2013 (36.3%), 2012 (26.8%), 2011 (27.4%), 2010 (29.3%), 2009 (26.6%)
- Allergen claims (dairy-free, soy-free, etc): 2014 (25%), 2013 (18.7%), 2012 (11.1%), 2011 (10.9%), 2010 (10.4%), 2009 (8.5%)
- Ethical/environmentally-friendly packaging: 2014 (21.8%), 2013 (20.3%), 2012 (14.4%), 2011 (13.7%), 2010 (13.6%), 2009 (8.5%)
- No additives/preservatives: 2014 (18.6%), 2013 (17%), 2012 (12.5%), 2011 (13%), 2010 (14%), 2009 (13.2%)
- Gluten-free: 2014 (23.6%), 2013 (13.8%), 2012 (11.9%), 2011 (13.1%), 2010 (13.9%), 2009 (12.1%)
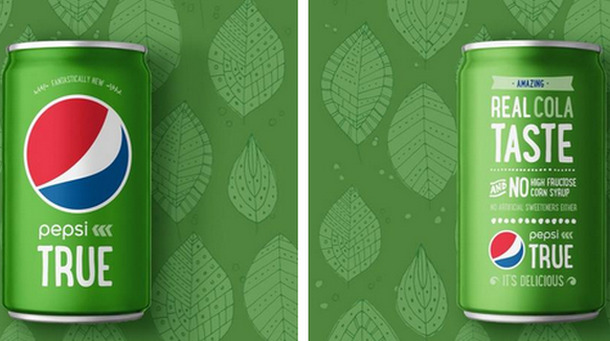
- Non-GMO/GMO-free: 2014 (10.2%), 2013 (6.5%), 2012 (2.8%), 2011 (2.7%), 2010 (1.6%), 2009 (1.9%)
- Ethical/environmentally-friendly product: 2014 (6.6%), 2013 (5.8%), 2012 (2.3%), 2011 (2.4%), 2010 (2.1%), 2009 (2.6%)
- Lactose claims (eg. lactose-free): 2014 (3.3%), 2013 (2.8%), 2012 (1.6%), 2011 (1.8%), 2010 (1.2%), 2009 (1.4%)
Claims holding steady 2009-2014… (% of new products making the following claims)
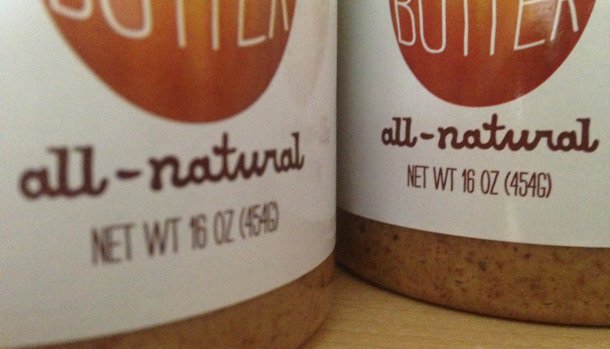
- All-natural: 13%
- Low/no/reduced fat: 8.2%
- Low/no/reduced sugar: 4.5%
- Low/no/reduced calories: 4.5%
- Low/no/reduced sodium: 3%
- Vitamin/mineral fortified: 2.4%
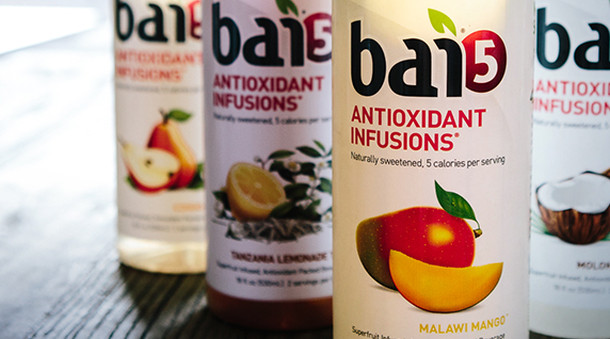
- Antioxidants: 2.2%
- High protein: 1.7%
- Caffeine-free: 1.2%
- Cardio health: 1.1%
- Immune health: 0.7%
- Brain health: 0.4%
- Bone health: 0.4%
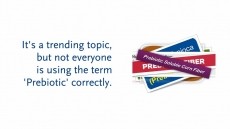
- Prebiotics: 0.2%
- Carbon neutral: 0.2%
‘Consumers believe that kosher products are somehow more wholesome’
Said Dornblaser: “Allergen claims are clearly a growth area, whether it’s gluten-free or lactose free or nut-free. We’re also seeing a continued rise in new products making kosher claims [up from 27% of new launches in 2009 to almost 41% in 2014]. It ties into the whole transparency thing as consumers believe that kosher products are somehow more wholesome.
“Environmentally-friendly packaging claims - even if it is just saying that the pack is recyclable - are also going up [from 8.5% of new launches in 2009 to almost 22% in 2014], along with no additives/preservatives type claims [up from 13% in 2009 to almost 19% in 2014].”
All-natural claims steady for six years at around 13% of new launches, but figure could go down in 2015/16
Natural and all-natural claims have been hovering very consistently at around 13% of new product launches for the past six years, said Dornblaser.
However, it is likely that this figure might drop in 2015 and 2016 as more companies decide to ditch the term, either for legal reasons - the threat of being slapped with a class action lawsuit - or because they feel there are better ways to indicate naturalness (shorter ingredients list, clean labels, packaging design etc).
10.2% of new products launched in 2014 featured non-GMO or GMO-free claims vs 2.8% in 2012
The biggest growth area is non-GMO and GMO-free claims, she said: “The area where we’ve seen the biggest rise in claims is GMO-free or non-GMO, which has gone from 2.82% of launches in 2012 to 6.49% in 2013 to 10.17% in 2014, as you’d expect with all the debate over GMOs and GMO labeling in the last couple of years.”
Vegan or ‘no animal ingredients’ claims on the rise
There has also been a steady rise - although the numbers are still low - in the percentage of new products making vegan or ‘no animal ingredients’ claims, with the latter going from 1.52% of new launches in 2009 to 5.31% in 2014.
However, vegetarian claims remained pretty steady at around 1.5% of new launches over the past six years, she said, not because people aren’t interested, but because it’s not a new ‘trend’.
She added: “With vegan, the trend is much newer, so companies are trying to make sure they tell those new vegans that their products are suitable for them. It would not surprise me at all if, in the next few years, we may see the claim dip a bit, as companies don't say they are vegan, but simply ARE and let consumers do the work. But, like gluten-free, vegan is hot now, so it's a benefit to make the claim.”
Follow me on Twitter! Social media related claims up sharply in past two years
Meanwhile, the number of launches flagging up social media-related things on front of pack has also surged in recent years, up from 4% in 2012 to 13.24% in 2014, said Dornblaser. “We’re talking about where the pack makes specific mention of Facebook, Twitter, etc., often by showing logos (e.g. follow me on Twitter #LynnMintel).”
Similarly, there has been a steady rise in the number of new products making ‘on-the-go’ claims from 1.88% in 2009 to 3.73% in 2014, said Dornblaser. “This covers products that specifically say they are suitable for taking with you or consuming in transit.”
High protein claims not growing, but lots of firms flagging up protein grams on front of pack
Finally, given the current trend to add protein to everything, the percentage of products making high protein claims has actually remained pretty steady at less than 2% in the past 6 years. However, this doesn’t reflect the fact that a lot of manufacturers are instead flagging up grams of protein on pack (which is not picked up by Mintel’s tracking), she said.
Low/no/reduced sugar claims holding steady
While there has been a lot of discussion about sugar lately - in part because the FDA is proposing to require manufacturers to list ‘added sugar’ on the Nutrition Facts panel - reducing it is not necessarily something companies are shouting about on pack, with low/no/reduced sugar claims on new products hovering at just under 5% for the past six years, said Dornblaser.
Instead, companies are talking in a more positive fashion about natural sweeteners, or real sugar, or not saying anything at all, reformulating by stealth, and letting the lower calories speak for themselves, she said.