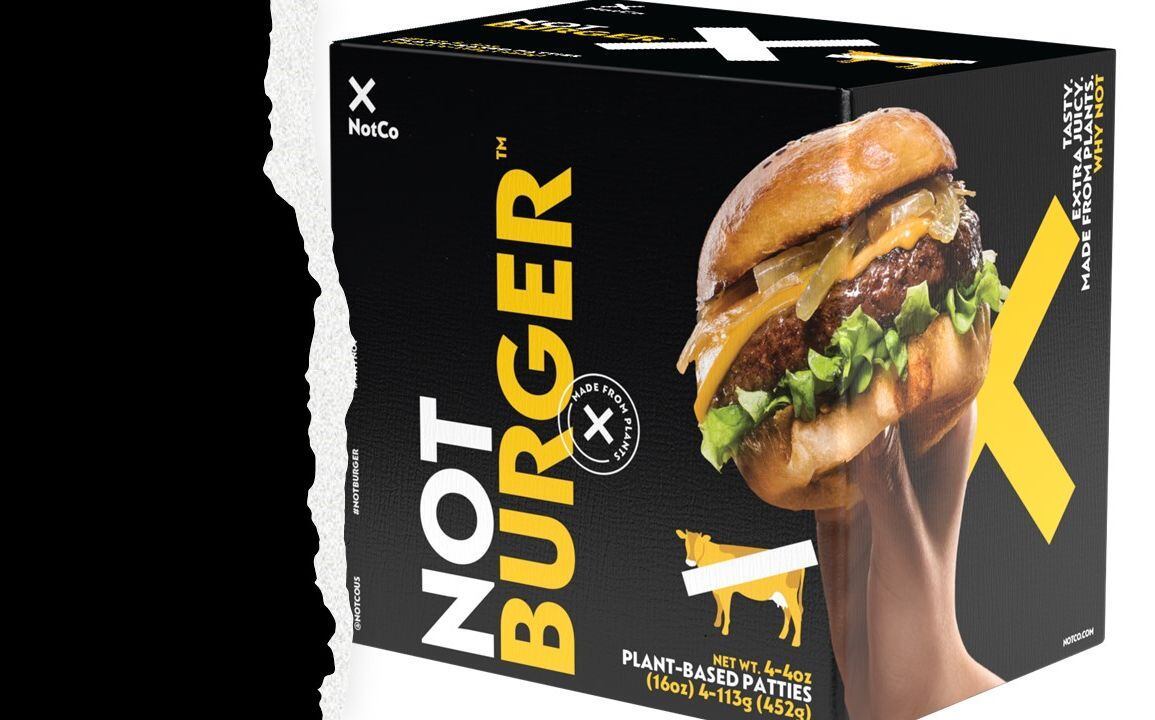
Right now, plant-based meat has about a 1.5-2% dollar share of the US retail meat market, depending on how you calculate it. The unit share is far lower due to these brands' very high unit pricing.
The plant-based meat slow-down may very well be the result of a terrifying truth: the addressable market at retail for plant-based meat offerings is not that big after all. Nor is it growing any more quickly than population growth and the natural creation of vegans/vegetarians in the broader culture.*
Again and again, we've read enthusiastic projections of plant-based meat's ultimate scale in the future, most from brand owners and 'institutes' studying the retail data. In 2017, for example, the Good Food Institute teed up the future scale of plant-based meat by imagining 10% of the total US meat market (foodservice and retail) as attainable.
These calculations derive from looking at retail or USDA sales data, calculating a recent multi-year CAGR, and then projecting into the future.
But, this can't be best practice.
Total addressable market
Around the year 2000, investment banking's internal phrase – Total Addressable Market (TAM) – started taking off in business and investing circles, especially in fast-growing venture-capital fueled sectors like plant-based meat. The term has become popular in English language media since 2010, according to Google's ngram database.
TAM is NOT a phrase created by seasoned market researchers or social scientists. It's an investment banking phrase. As such, there is always a heavy dose of optimism built-in when it typically gets used. Nor is there ANY regulation about how to calculate it before tossing it in front of public fund managers whose money you may desire.**
One thing you'll learn talking to any seasoned PhD-level demographer is that, aside from population datasets, you don't make long-term forecasts (i.e., beyond five years) about small phenomena. You don't do it about small phenomena dependent on many variables you can't analytically control.
No innovation ever captures the TAM. Ever. Ever. Ever.
Consumer behavior at the register and its interaction with world events are all you need to imagine when you read the phrase "variables you can't control."
This is why market research pros would never sign off on ANY market forecast beyond 3-5 years when it depends on human behavior. Human behavior is predictable in the near future, not the far-off future. If the last two years haven't convinced you of this already, then I have no other argument that will work.
However, the intelligent Morgan Stanley analyst knows to distinguish between the serviceable addressable market (SAM) and the total addressable market (TAM) because it's clear from rigorous case study work that no innovation ever captures the TAM. Ever. Ever. Ever.
This crucial distinction seems to vanish in the media and many pitch decks. For example, constant pronouncements about the size of the meat marketplace tempt us all to slice out 10, 15, or 20% market share of meat like some market wizard, without really thinking too hard about one little question: What portion of the meat market could any plant-based meat brand ever permanently win over in today's environment? Or in a few years, given specific variables?
The presentist fallacy
After nearly fifty years of growth (peaking around 2008), for example, retail premium CPG is still at most 12-15% of market share in the U.S. omnichannel marketplace. And even more confusing to the uninitiated, category premium $ share varies from 1-40% depending on cultural, regulatory, and market variables. The variation in premium share is explainable mainly, but it requires patience and time.
If current retail growth rates in a segment or a new category suggest more than ten years' journey to your desired market share end game, you need to stop. Right. There. You have the wrong time horizon for addressable market analysis.
Investors looking for a quantitative means to measure potential scale ten years out or more probably need to adjust their view of risk more than fine-tune their TAM and SAM formulas. Don't call a social scientist to help.
What remains strange to me is why it is so difficult for investors, investment bank analysts, and founders to utilize a conservative formula for a brand's potential scale.
The best way to do this is to stop entirely thinking about top-down share calculations. These lazy calculations succumb to the presentist fallacy, believing that the variables converging to create a current phenomenon will remain fixed in the future (where your projection lives).
It isn't responsible for any stakeholder to put out anything more than a five-year forecast in the consumer sector
Instead, responsible investors and cool-headed operators should use a bottoms-up set of human behavior variables to understand how a segment or sector generates growth. And as your understanding of those variables changes, so must the near-term forecast. More importantly, it isn't responsible for any stakeholder to put out anything more than a five-year forecast in the consumer sector. Not without at least offering variable-based scenario options when doing so. This should be SEC policy, in my opinion.
In a less giddy world than ours, bottoms-up formulas for a brand's scale potential would reign supreme, offering high, medium, and low projections on a maximum of a five-year-out basis.
Here are the components that bottoms-up addressable market formulas and forecasts should play with when imagining the potential scalability of any growth segment.
- Combined market share of ALL premium-priced offerings in the most intuitive macro-category, the innovation fits culturally. For example, in meat (e.g., organic, dry-aged, and specialty meat) - what evidence would suggest the innovation could grow premium $ share or not?
- HH penetration overlap among brands - unless you assume general incompetence among your competition, most new growth food segments get split up by 2-4 players, in my experience. Constant switching may occur and get revealed in a segment-wide household penetration not much more than the sum of each brand's household penetration. This competitive frenzy may not grow the space; therefore, always be on the lookout for household overlap between the leaders.
- HH penetration growth rate - if this starts declining for the broader space early on, it's probably the most damning signal there is. It's the master KPI for big brands. Using absolute buyer counts in panels or loyalty card datasets is even better and crucial for smaller brands and segments.
- % of revenue tied to consumers coming into the space (or back into it) - most category consumers have no desire to change their habits in food. You are much more likely to create massive growth by getting folks to come back to the category or try it out first (usually on a new occasion). Note: if your category has 95% HH penetration, this may not apply. This is why I still believe that Beyond Meat's real prize is global vegetarianism.
- Correlation of early relaxed ARP with growth response (does it accelerate or not?) - if aggressive price drops don't yield a baseline velocity increase, be very concerned. If they are required early to keep growth going, the power of unit pricing parity with the mainstream category may be weak, and ultimate market share will usually tap out early.
- Average brand velocity trend vs. the category leaders. In this case, you would benchmark Beyond Meat first against Morningstar Farms (immediate category) and then against raw meat patties (i.e., the TAM). Is it making progress toward the velocity of leading brands in either, or is it decelerating?
If aggressive price drops don't yield a baseline velocity increase, be very concerned
These are all bottoms-up, conservative indicators of how well your 'space' is growing.
If you use one or all of them, you will slowly develop a near future view of your brand and your category, which, in my experience, is the perspective of the most successful emerging brands. That's because this attention to detail will help your team catch segment issues early and move quickly before your arrogant competitor does.
The folks who carve out giant slices of TAM to eat early on and focus too much on beating competitors by scaling as fast as possible may find it very hard to adapt to the small slice of market share the consumer is willing to give them when this reality hits.
The Good Food Institute recently published a Mintel-derived chart which reveals that only 25% of consumers see the price of plant-based meat brands as too expensive. This may not be an accurate measurement, but even so, it doesn't bode well for any plant-based meat brand whose strategy for growing to $1bn or more relies on price parity with raw meat.
It seems more evident that price is the least of plant-based meat's problems. More likely, the real problem has been the non-scientific approach to addressable market projections to accumulate Wall Street money for these businesses.
* Grand View Research offers up a 17.9% $CAGR through 2030
**Shyam Jha offers a concise explanation of TAM and related terms on his site.

James F. Richardson, Ph.D. – a cultural anthropologist turned business strategist for emerging food and beverage brands - is the founder of Premium Growth Solutions, a consultancy for entrepreneurs and investment firms focused on the premium end of retail food and beverage, the host of the Startup Confidential podcast, and the author of Ramping Your Brand: How to Ride the Killer CPG Growth Curve


