The EHM study was fielded over two three-year periods, 2006-08 and 2014-16, and based on approximately 36,000 interviews of individuals aged 18 and over.
“Understanding how individuals and households allocate time to food-related activities can provide insight into behaviors associated with nutrition and diet-related health,” researchers said in the report.
Time spent eating across age groups
On an average day, Americans aged 18 and older reported spending 64.5 minute eating and drinking eating as a primary/main activity and 16.8 minutes eating as a secondary activity (i.e. eating while engaged in another activity considered primary by the individual).
While time spent eating as a secondary activity did not change much between the 2006-2008 and 2014-2016 periods, the amount of time spent eating as primary activity decreased by 5%.
“The 5% decrease in the time spent engaged in primary eating and drinking from 2006-08 to 2014-16 is mostly driven by households without children aged 17 and younger,” the study’s researchers said.
Individuals aged 65 and older spent about 20% more time eating and drinking as a primary activity relative to younger age groups – 74.6 minutes vs. 62.1 minutes. This same age group also spend 23% less time than younger age groups eating as a secondary activity.
“This may be the result of less time pressure faced by individuals age 65 and older,” researchers noted.
According to the report, individuals 65-years-old and older spent significantly less time at work relative to younger age groups (50.2 vs. 244.5 minutes), and they are also less likely to have children at home competing for their time.
Households consisting of a childless couple spent the most time engaged in primary eating and drinking, about 17% more time than other household types (72.2 vs.61.8 minutes) while single-parent households spent the least amount of time engaged in primary eating—about 21% less time than other types of households (51.8 vs. 65.2 minutes).
The research also showed that education levels impacted the amount of time spent eating and drinking as a primary or secondary activity.
Individuals with more than a bachelor’s degree (master’s degree, professional school degree, or doctoral degree) spent about 18% more time than lesser educated individuals eating and drinking as a primary activity (74.3 vs. 63.2 minutes). These individuals also spent about 18% more time than individuals with less education eating as a secondary activity (19.3 vs. 16.4 minutes).
Prepared food purchases
As Americans reported spending less time eating as a primary activity, the data collected over the two three-year periods showed that prepared food purchases have also increased.
Men taking over meal prep

The percentage of Americans engaged in meal preparation on an average day increased from 49.9% to 55.3% from 2006-08 to 2014-16, according to the report, with the increase being mostly driven by men.
While the share of men who reported they are the usual meal preparer in the household was about 53% lower compared to women, the share of men who reported being the usual meal preparer in their household was about 16% higher from 2006-08 to 2014-16
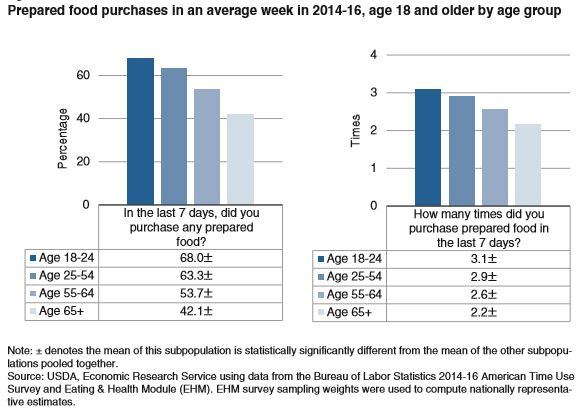
On an average day over 2014-16, about 58.2% of Americans aged 18 and older had purchased prepared food from a deli, carry-out, delivery food, or fast food in the last seven days – and reported doing so 2.8 times over those seven days.

Men aged 18 and older were more likely to purchase a prepared food option than women (3.1 times per week for men vs. 2.5 times for women). Younger Americans (age 18 -24) purchased prepared food more frequently than older individuals (68% vs. 42.1%).
What about grocery shopping behavior?
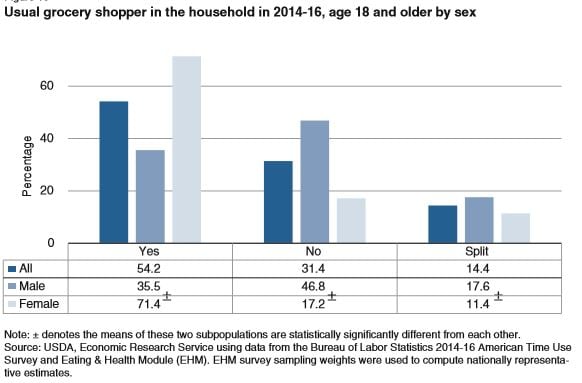
On an average day over 2014-16, about 54.2% of Americans aged 18 and older reported being the one who usually did the grocery shopping in their household, and 14.4% reported that this responsibility was equally split with other household members.

The share of men who reported that they usually did the grocery shopping in their household was about 50% lower than the corresponding share of women (35.5% versus 71.4%).
However, the share of men who reported they usually do the grocery shopping in their household was roughly 10% higher in the 2014-16 than it was 2006-08.
Most individuals reported shopping at a traditional grocery store (68.6%) whereas 23.8% purchased the majority of their groceries at a supercenter.


