Speaking at an educational event in Napa Valley hosted by the Peanut Institute earlier this month, Alanna Moshfegh, research leader in the food surveys research group at USDA’s agricultural research service, said poor eating habits were being established very early, despite the fact that parents have significant, if not total, control over what children under the age of two eat.
Big differences in fruits and soft drink consumption between ethnic groups
As for those aged over two, an analysis of 2011/12 National Health and Nutrition Examination Surveys (NHANES) data showed that half of Americans, on any given day, eat no fruit at all, while around 30% consume no vegetables on any given day, she revealed.
However, the figures varied greatly by ethnic group, with the percentage of Asian Americans reporting eating fruit on any given day the highest at 63%, whereas the percentage of African Americans reporting eating fruit on any given day was just 33%. The figures for Hispanics and whites were 44% and 45% respectively.
2011/12 NHANES data also highlighted big differences in soft drink consumption habits, with 41% of African Americans reporting drinking soft drinks on any given day compared with 41% of Hispanics, 28% of Whites and 22% of Asian Americans. Meanwhile, a far lower percentage (29%) of Asian Americans also reported eating cookies, cakes and pastries than White Americans (42%), Hispanics (39%) and African Americans (38%).

Snacks account for 24% of energy and 37% of added sugar intakes
Overall, snacks** (which might include some beverages, as it is based on what consumers described as a snack) account for around 24% of Americans’ energy intakes, but 37% of their total sugar intakes, said Moshfegh, while beverages accounted for 18% of calories but 46% of added sugar.
Boys and young men get a higher percentage of energy from added sugar

Looking at added sugar intakes by age and gender, boys and young men consumed the most, with males aged 12-39 getting a whopping 18.39% of their calories from added sugars, or 25 teaspoon equivalents (the average for all Americans aged over two years was 14% (which is still well above WHO advice of no more than 10%, and ideally <5%).
Micronutrient intakes
Looking at micronutrients, 93% of Americans failed to meet recommendations for vitamin D, 83% failed to get enough vitamin E, 47% failed to get enough magnesium, 39% didn’t get enough vitamin A, 38% didn’t get enough calcium and 38% didn’t get enough vitamin C.
Sodium intakes have remained fairly consistently around the 3,500mg mark since the late 1970s - with men consuming significantly more than women (mainly because they eat more calories).

Fat intakes down, carbs up, protein around the same
Analysis of macronutrient intakes over the period 1977/78 to 2011/12 show that fat consumption went down from 40% to 33% of energy intakes; protein consumption dropped slightly from 17% to 15%; and carbohydrate intakes went up (along with obesity levels), from 43% to 51%.
Americans more likely to skip lunch than breakfast
Finally, when it comes to skipping meals, Americans are most likely to skip lunch, with 81% reporting that they eat lunch on any given day vs 85% reporting eating breakfast and 93% reporting eating dinner – percentages that haven’t actually changed much since the late 1970s, observed Moshfegh.
Snacking trends
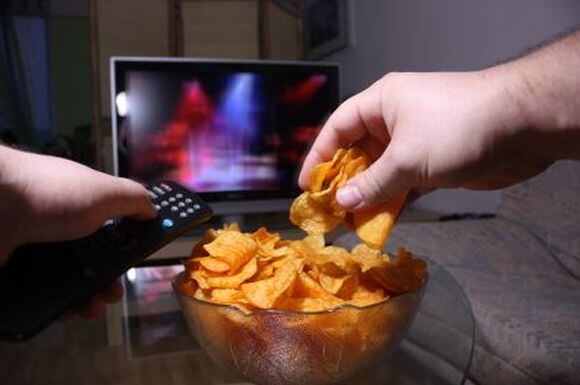
The biggest change, however, was in snacking, with 41% of Americans reporting eating 3-4 snacks a day in 2011/12 vs just 9% of Americans in 1977/78.
Similarly, just 4% of Americans reported eating no snacks at all on any given day in 2011/12 vs 40% of Americans in the late 1970s.
*The data on toddlers was from the What We Eat In America (WWEIA) National Health and Nutrition Examination Surveys (NHANES), for 2007-10.
**According to Moshfegh: "Snacks are self-defined and reported by respondents and can include beverages. They are eating occasions that are not self-defined as breakfast, lunch, or dinner."
Moshfegh also unveiled some data on peanut and peanut butter consumption patterns at the event:
- 3% of Americans eat peanuts as a standalone food on any given day (eg. data excludes foods containing peanuts such as Snickers bars).
- 9% of Americans eat peanut butter on any given day.
- Broken down by age, 15% of 2-5 year olds eat peanut butter on any given day, compared with 11% of 6-11 year olds, 8% of 12-19 years olds, 9% of 20-59 year olds and 12% of those aged 60+.
Read more HERE.
